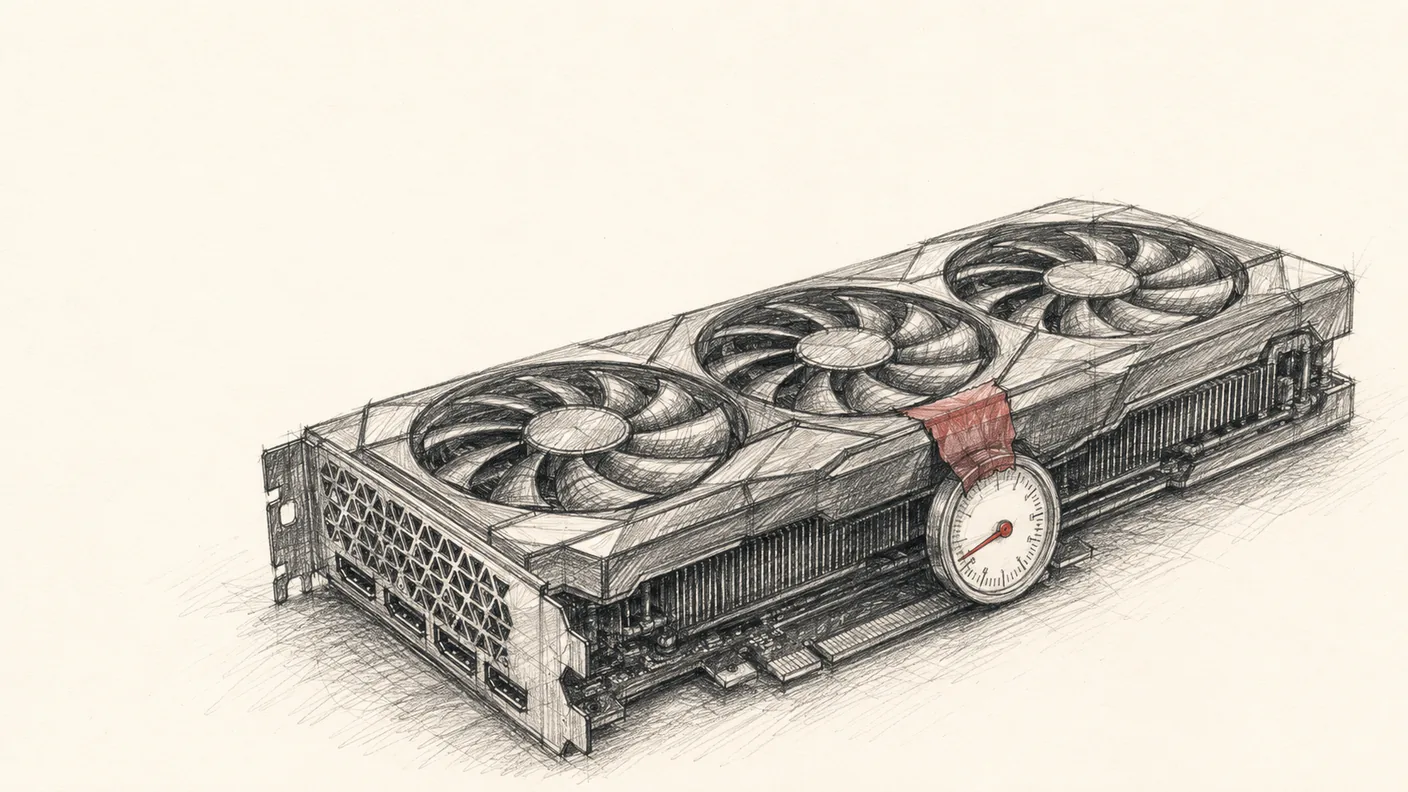
I Strapped a $15 Sensor to My GPU. It Read the Load Backwards. Here’s How to Calibrate It.
In shortI taped a $15 Zigbee probe to an RTX 3090 Ti expecting hotter to mean busier, and at 87 percent utilization it averaged 28.8 C, the coldest phase. At 41 percent it read 30.3 C, its warmest. Heavy load spins the fans, which wash room air at about 20 C over the open-air cooler and the sensor on top. A local LLM handed the same trace made the same mistake, calling 1 of 7 heavy segments correctly.
I had a $15 Zigbee fridge sensor and an RTX 3090 Ti. Could the sensor tell me when the card was working?
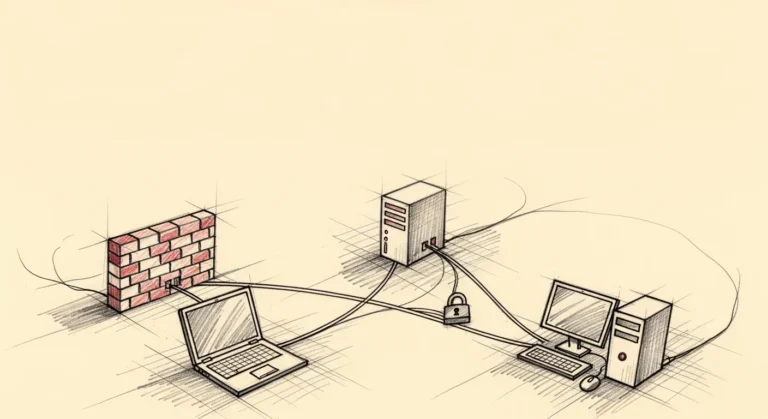
The appeal is that it costs nothing to try and asks nothing of the machine: no drivers, no root, no host access. A stick-on probe just reports its own temperature over MQTT, straight into the smart-home stack I already run. If a cheap external sensor could read GPU load off the heat coming off the card, that would be a GPU thermal side channel anyone could bolt on in about five minutes.
The answer turned out to be yes, but only after the sensor lied to me, and then talked a local LLM into repeating the lie.
Tape it on and place the bet
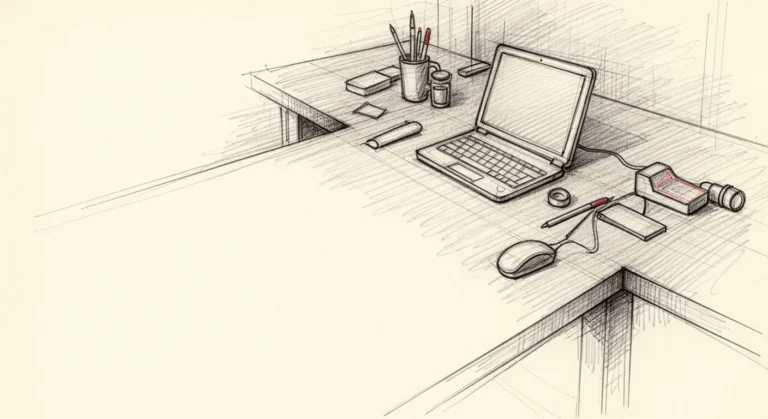
The bet is the obvious one: hotter means busier. Drive the card hard, watch the sensor climb. So I taped a Sonoff SNZB-02LD (~$15, the kind of Zigbee probe people drop in a fridge) to the top of the card, piped it through zigbee2mqtt (routed by the same SLZB-07 coordinator mesh that runs the rest of my smart home), and watched to see whether the reading tracked load.
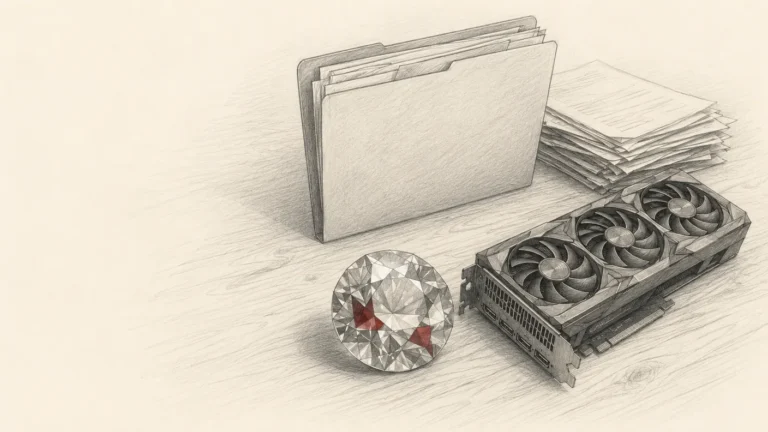
Here is the bench. The card is an NVIDIA RTX 3090 Ti with an open-air cooler, meaning the fans blow straight through a finned heatsink into the room rather than a sealed blower that exhausts out the back. It runs a self-hosted local LLM, served by the llama.cpp build on this same card. The answer key is nvidia-smi, which reports die temperature, SM utilization, and power draw, the ground truth the external sensor never sees on its own. (One rule shaped the whole run: because this GPU serves a production model other things in my house depend on, I drove “heavy” and “light” by sending real inference requests at varying concurrency, never a foreign stress tool that would fight the live model for the same silicon.)
One constraint worth flagging early: the Sonoff only reports a new reading on a 0.5 C change or a roughly 5-minute heartbeat. Across the entire 23-minute experiment, that yielded about 9 probe readings total, with some phases getting zero. Sparse data is part of the honest story.
So I ran a scripted workout, 4 to 6 minutes per phase: idle, heavy, light, heavy, idle.
What the sensor said: GPU load, read backwards
Here is the full per-phase data. Every number comes from the experiment logs.
| Phase | Duration | Die Temp (C) | Utilization (%) | Power (W) | Probe (C) | Probe Samples |
|---|---|---|---|---|---|---|
| IDLE_A | 240 s | 61.0 | 50.2 | 234 | (none) | 0 |
| HEAVY_A | 339 s | 67.0 | 86.9 | 325 | 29.8 | 2 |
| LIGHT | 240 s | 59.2 | 41.0 | 215 | 30.3 | 1 |
| HEAVY_B | 340 s | 67.1 | 87.1 | 327 | 28.8 | 2 |
| IDLE_B | 240 s | 63.9 | 62.3 | 276 | 29.8 | 2 |
Look at LIGHT and HEAVY_B. When the chip worked hardest (87% utilization, 67 C die, 327 W), the external sensor averaged 28.8 C for that phase, the coldest phase mean of the run. When the chip was loafing (41%, 59 C, 215 W), the sensor read 30.3 C, its warmest. The GPU’s own die sensor tracked load correctly. The external probe tracked it in reverse. Coldest at full tilt, warmest at near-idle: the exact opposite of the bet.
The LLM falls for it too
If you glanced at that table and your gut said the warm phase must be the busy one, you are in good company. I fed the inverted temperature trace (and nothing else) to my local LLM and asked it to classify the workload into idle, light, and heavy segments, and it made the same guess you just did.
It never once flagged a heavy phase. It looked at the lowest single sample in the trace, 28.3 C, which was recorded during peak heavy load, and classified it as “the lowest observed… likely full idle/low-power state.” It called the warmest stretch the busiest. The entire classification was backwards, delivered confidently.
The model reached for the intuition anyone would: hotter means busier. That heuristic is correct for a sensor bonded to a chip and dead wrong for one washed by room-temperature air off an open-air cooler. The failure is the prior, not the model; a human analyst given the same trace and no placement context would invert right along with it.
The score: 1 of 7 time segments correctly identified as heavy load. Not once did it label a truly heavy segment “heavy.” The flatness of the trace (only about 2 C total swing) was the one clue something was off. A well-calibrated response would have hedged on direction and asked for placement context. Instead the model explained the flatness away and never questioned its own assumption.
Why the sensor lies: open-air cooler airflow
The probe wasn’t broken or noisy. It was consistent and cleanly inverted. The Sonoff sits on top of the card, in the fan exhaust path. On an open-air cooler, heavy load makes the fans spin faster, and faster fans pull more room-temperature air (about 20 C in my office) across the heatsink and the sensor taped to it.
- Heavy load -> fans ramp -> more ~20 C room air washes over the sensor -> probe reads lower.
- Light/idle -> fans slow -> warm stagnant air pools around the sensor -> probe reads higher.
The sensor faithfully measured the cooling system, not the chip. It isn’t reading die temperature through the card body either: there’s an air gap between the die, the heatsink fins, and the sensor on top, so the dominant thermal path to the probe is airflow, not conduction. The entire swing was about 2 C (28.3 to 30.3 across individual readings). That looks like noise until you check it against the answer key: it anti-correlates with load across the phases that produced readings. Small signal, real structure.
Academic work like Energon (ICCAD 2025) uses on-die GPU power and thermal sensors to infer transformer architecture. This experiment takes the opposite approach: an external ambient probe that reads the cooling system, not the chip, and gets the sign wrong until calibrated.
So can we actually do that? Yes: calibrate against nvidia-smi
Back to the opening question: can the $15 sensor tell you when the card is working? Yes, but not by trusting the raw number. Both the sensor and the LLM failed for the same reason: no ground truth during interpretation. The fix for both is identical. Pair the sensor data with the GPU’s own telemetry and let the mapping emerge from measurements, not assumptions.
The only tool required beyond the sensor itself is nvidia-smi, which ships with the NVIDIA driver and doesn’t need root. No homelab-specific dependencies.
Step 1: Collect paired data. Run nvidia-smi in logging mode alongside your MQTT sensor feed, both timestamped.
nvidia-smi --query-gpu=temperature.gpu,utilization.gpu,power.draw \
  --format=csv,noheader,nounits -l 5 | ts '%FT%T' >> gpu_truth.csv

# Side channel: Zigbee probe via MQTT (adjust topic for your device)
mosquitto_sub -t 'zigbee2mqtt/temp_probe' | \
  jq -r '[now | todate, .temperature] | @csv' >> probe.csv
Step 2: Drive a known load pattern. Run the workload you actually care about at clearly different intensities. The five-phase pattern I used (idle, heavy, light, heavy, idle) works well because it gives you both directions of the transition, which is what reveals the sign. More phases and longer duration per phase means more paired readings from a slow-reporting sensor like the Sonoff.
Step 3: Feed both streams to the agent. Give your LLM (or a script) the sensor trace and the nvidia-smi log, timestamped and aligned. With both streams visible, the mapping is recoverable. “When utilization is 87% and die temp is 67 C, the probe reads 28.8 C. When utilization is 41% and die temp is 59 C, the probe reads 30.3 C.” The probe is anti-correlated with load. Once the model sees both, it stops guessing the physics and reads the actual relationship.
Step 4: Validate. On this dataset, the mapping is straightforward: lower probe temperature means higher GPU load. A simple threshold or linear fit against utilization gives you a load proxy from the sensor alone, once calibrated. With the paired data, the agent can now say “probe dropped 1.5 C in the last 10 minutes, which in the calibration run corresponded to a jump from 40% to 87% utilization, so load likely increased significantly.” That is a useful signal from a $15 sensor and zero driver access. Denser sensor readings and more phases would tighten the fit and give you confidence intervals.
The asterisk that keeps me honest
The “idle” phases were never idle. This GPU sits behind a router that serves a production local model, and requests kept arriving during my idle windows. The answer key proves it: IDLE_A showed 50% utilization, IDLE_B showed 62%. I never got a true floor.
That contaminates the idle-versus-everything story. The data I can defend is the light-versus-heavy contrast, where my scripted load dominated whatever the router was sending. Light load: probe warmest (30.3 C). Heavy load: probe coldest (28.8 C). The inversion holds cleanly on the comparison the experiment actually controlled.
To be precise about what I demonstrated versus what I did not: this is a calibration recipe shown on real paired data, 9 probe readings across 5 phases on a single GPU at a single room temperature. I did not build an autonomous agent that ran the calibration and fit a production model; that is an exercise for the reader with more patience and a longer logging window. Other limits, stated plainly: n=1 GPU, single sensor placement, single room temperature (roughly 20 C), about 2 C total probe swing. The clean re-run pauses the router for a true idle floor and runs longer phases for denser sampling. Reporting the contamination is more convincing than a suspiciously perfect baseline.
What this gets you
Once calibrated, a $15 Zigbee sensor becomes a remote, rootless GPU load indicator reported over MQTT. That is useful for monitoring a GPU you don’t have shell access to (but can stick a sensor on), for anomaly detection from a relative baseline shift without any driver integration, or for GPU awareness in a Zigbee home-automation stack without touching the host. For ground-truth numbers I still lean on a proper Grafana telemetry stack watching the same GPU, which needs the host access this trick sidesteps.
Not useful for replacing nvidia-smi, reading precise utilization percentages, or single-reading classification. The roughly 2 C swing needs averaging and context to interpret. A blower-style card (sealed shroud, exhaust out the back) would push hot air past the sensor, so the sign likely stays intuitive there without calibration. On open-air cards like the 3090 Ti, the room-air cooling effect dominates. Either way, one calibration pass tells you which world you are in.
Next: a clean re-run with the router paused for a true idle floor, and bonding a sensor directly to the heatsink fins to see whether the sign flips back to intuitive.
FAQ
Can temperature sensors reveal what a GPU is doing?
Yes, but the sign depends on placement. An external probe in fan exhaust anti-correlates with load on open-air cards: heavier work means more cooling airflow and a lower reading. A probe bonded to the heatsink should correlate positively. Calibrate against nvidia-smi once to learn which direction your specific placement reads.
Does GPU fan speed correlate with workload?
Directly. Fan speed ramps with die temperature, which tracks utilization. In this experiment, fan speed caused the probe inversion: faster fans pushed more room-temperature air over the sensor. If you can read nvidia-smi --query-gpu=fan.speed, fan speed is actually a better load proxy than the external temperature it creates.
How can I monitor GPU load without nvidia-smi?
An external sensor calibrated per this recipe gives a coarse proxy over Zigbee or MQTT, no driver needed. For driver-level alternatives, nvtop and gpustat provide real-time GPU monitoring but still require the NVIDIA driver underneath. lm-sensors reads some GPU temps on supported cards, and IPMI provides out-of-band telemetry on server-class boards. The external sensor is the simplest option that works without any driver or host access.
Why did the LLM classify the temperature trace incorrectly?
It applied the intuitive prior that hotter means busier, which is correct for a sensor bonded to a chip and wrong for one sitting in fan exhaust. Given only the inverted trace, the model read the coldest samples (recorded under peak load) as idle and the warmest as busiest: 1 of 7 segments right, and not once did it flag a heavy phase. The fix is not a better prompt, it’s ground truth. Pair the sensor with nvidia-smi so the model learns the actual mapping instead of guessing the physics.
What is a thermal side channel?
Measuring a system’s behavior indirectly through the heat it gives off rather than reading its state directly. The security version infers cryptographic keys from timing or power traces. This experiment uses the same principle at coarser grain: inferring GPU workload from a $15 sensor taped to the card. The “side” means you’re reading a leak, not the source.
How a CEO uses Claude Code and Hermes to do the knowledge work
A blank or generic config file means every session re-explains your workflow. These are the files I run daily as CEO of a cybersecurity company managing autonomous agents, cron jobs, and publishing pipelines.
- CLAUDE.md template with session lifecycle, subagent strategy, and cost controls
- 8 slash commands from my actual workflow (flush, project, morning, eod, and more)
- Token cost calculator: find out what each session is actually costing you
One email when the pack ships. Occasional posts after that. Unsubscribe anytime.