
How I Track Claude, Codex, and Gemini Quotas from One Script
Updated May 30: added what I learned wiring these three together, plus the budget thresholds that now trigger automation.
<\!-- wp:paragraph -->(If you’re trying to decide which model to switch to when one runs dry, I benchmarked 15 models on 38 real coding tasks with full cost-per-task breakdowns.)
<\!-- /wp:paragraph --> <\!-- wp:image {"sizeSlug":"large"} -->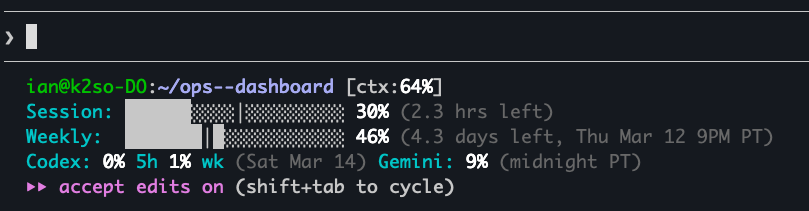
I run three AI coding CLIs daily. None of them tell me whether I’m about to hit a rate limit. I periodically get locked out mid-task and spend ten minutes figuring out which tool ran out, when it resets, and whether I should switch models or wait.
I built a script that collects quota data from all three, writes it to a single JSON file, and runs on an hourly cron. The whole thing feeds a status line in Claude Code:
Session: ███░░░⏐░░░░░░░░░░░░░ 10% (3h12m left)
Weekly:  ████████░░⏐░░░░░░░░░ 44% (Thu Mar 05 8pm PT)
The filled blocks (█) show usage consumed. The marker (⏐) shows where you are in the time window. If the blocks outpace the marker, you’re burning budget faster than time is passing.
How do you query Claude Code’s rate limit programmatically?
Claude Code authenticates via OAuth, with credentials stored at ~/.claude/.credentials.json. What I couldn’t find in any official documentation is that api.anthropic.com/api/oauth/usage returns the data you need: utilization percentages and reset timestamps for both the 5-hour rolling window and the 7-day weekly allocation. It’s used internally by Claude Code’s HUD, but it doesn’t appear in Anthropic’s public API reference.
TOKEN=$(jq -r '.claudeAiOauth.accessToken // empty' "$HOME/.claude/.credentials.json")

curl -s --max-time 10 \
  -H "Authorization: Bearer $TOKEN" \
  -H "anthropic-beta: oauth-2025-04-20" \
  https://api.anthropic.com/api/oauth/usage
The response:
{
  "five_hour": { "utilization": 0.42, "resets_at": "2026-02-28T17:00:00Z" },
  "seven_day": { "utilization": 0.61, "resets_at": "2026-03-07T08:00:00Z" },
  "seven_day_sonnet": { "utilization": 0.35, "resets_at": "2026-03-07T08:00:00Z" }
}
I found this by searching Anthropic’s GitHub issues for “usage” and “quota,” then trying endpoints until one worked. The catch is that anthropic-beta: oauth-2025-04-20 header. Without it, you get a 401. The date in the version string suggests this header has been updated before, so when it changes again, the collector breaks silently.
Claude Code uses a 5-hour rolling session window, not a 24-hour one, and the weekly limit resets Thursday at 8pm PT, not midnight UTC. I only discovered both by watching the numbers change over a week of collection. The docs don’t mention either detail.
I’ve been hitting this endpoint hourly since February with zero failures. But “undocumented beta endpoint” is not a phrase that inspires long-term confidence.
How do you track Gemini CLI usage without an API?
Gemini CLI has a /stats command that works interactively, but non-interactively it completes silently with no output (the stats render through Ink, a React-based terminal renderer, which doesn’t survive piping or capture). GitHub issue #19067 has a user asking the same question I had. The maintainer response: “there’s no way within Gemini CLI to see your daily quota.”
The workaround: Gemini stores session files at ~/.gemini/tmp//chats/session-YYYY-MM-DD.json. Each file is one session. The free tier allows 1,000 requests per day, resetting daily. There’s no official way to query how many you’ve used. You count your own files. I verified the session counts against Google’s AI Studio usage dashboard to make sure the file-based approach was tracking correctly.
A note on what this actually measures: the free tier limit is requests, but what we’re counting is session files and token consumption. Session files don’t map 1:1 to API requests (a single session can contain multiple turns), so the session count is a lower bound, not an exact quota meter. For my usage patterns, the counts track closely enough to be useful as a warning signal, but they won’t catch you at exactly request 999.
Counting files only tells you session counts. For actual consumption data, you parse the JSON. Each session file has a messages array where every message includes a tokens.total field:
files = glob.glob(os.path.join(base, '*/chats/session-*.json'))
for f in files:
    fname = os.path.basename(f)
    file_date = fname[8:18]  # YYYY-MM-DD from session-YYYY-MM-DDTHH-MM-*.json
    with open(f) as fh:
        data = json.load(fh)
    file_tokens = sum(
        m.get('tokens', {}).get('total', 0)
        for m in data.get('messages', [])
    )
    if file_date in week:
        week[file_date]['sessions'] += 1
        week[file_date]['tokens'] += file_tokens
The output includes today’s session and token counts, lifetime totals, and per-day breakdowns for the past week. All from flat files that were never intended to be an API. If Google changes the session file schema or directory structure, there’s no migration path. You find out when the numbers stop updating.
How does Codex CLI expose rate limits?
Codex has an interactive /status command that shows rate limits in a TUI modal. The same problem as Gemini: it only works inside the REPL (the interactive read-eval-print loop). codex /status exits immediately with nothing.
My first approach felt like performing surgery with oven mitts: launch Codex inside a tmux session, send /status as keystrokes, wait for the modal to render, press Escape to dismiss it, send /help to push the status into the scroll buffer, capture 300 lines of scroll history, grep for “% left.” It required sleep statements between every step and never worked reliably.
Then I found codex app-server.
Codex ships with an app-server subcommand that speaks JSON-RPC over stdin/stdout. OpenAI has documentation for it, though I only found it after discovering the feature in the source code. The account/rateLimits/read method isn’t prominently featured, but it works. You spawn the process, send an initialize handshake, then call it. The 500ms delay between handshake and request is necessary because shorter values produce empty responses before the connection is ready.
const proc = spawn('codex', ['app-server'], { stdio: ['pipe','pipe','ignore'] });
const rl = readline.createInterface({ input: proc.stdout });

const send = (m) => proc.stdin.write(JSON.stringify(m) + '\n');

// Handshake
send({
  method: 'initialize', id: 0,
  params: { clientInfo: { name: 'quota-collector', title: 'Quota Collector', version: '1.0' } }
});

// Request rate limits after handshake completes
setTimeout(() => send({ method: 'account/rateLimits/read', id: 1, params: {} }), 500);
The response comes back with rateLimits.primary (five-hour window) and rateLimits.secondary (weekly), each with usedPercent and resetsAt. No scroll buffer archaeology required.
The Codex account/rateLimits/read method
account/rateLimits/read is the JSON-RPC method Codex’s app-server exposes for quota data. Spawn codex app-server, send the initialize handshake, wait 500ms, then call it. The reply carries rateLimits.primary (the five-hour window) and rateLimits.secondary (weekly), each with usedPercent and resetsAt.
Codex also maintains a SQLite database at ~/.codex/state_5.sqlite (the _5 is a schema version, so this path may change in future releases) with a threads table that tracks every session:
WITH days AS (
    SELECT date('now', '-' || n || ' days') AS day
    FROM (SELECT 0 AS n UNION SELECT 1 UNION SELECT 2
          UNION SELECT 3 UNION SELECT 4 UNION SELECT 5 UNION SELECT 6)
)
SELECT d.day, COUNT(t.id) AS sessions, COALESCE(SUM(t.tokens_used),0) AS tokens
FROM days d
LEFT JOIN threads t ON date(t.created_at, 'unixepoch') = d.day
GROUP BY d.day ORDER BY d.day;
The collector: one cron, one JSON
claude_json=$(collect_claude)
codex_json=$(collect_codex)
gemini_json=$(collect_gemini)

ts=$(date -u +%Y-%m-%dT%H:%M:%SZ)

jq -n \
    --argjson claude "$claude_json" \
    --argjson codex "$codex_json" \
    --argjson gemini "$gemini_json" \
    --arg ts "$ts" \
    '{collected_at: $ts, claude: $claude, codex: $codex, gemini: $gemini}' \
    > "$OUTFILE"
After writing latest.json, the script appends a compacted copy to a daily JSONL file for historical tracking. One line per collection, roughly 15 lines per day, about 2KB. Want to know how fast you burned through your five-hour window last Tuesday? jq -r '.claude.five_hour.utilization' quota/history/2026-03-11.jsonl and watch the numbers climb line by line.
How I display it
A separate status line script reads latest.json and renders progress bars on every Claude Code interaction. Green below 70%, amber at 70-90%, red above 90%. The time marker (⏐) gives you an instant burn-rate signal without reading numbers.
The same JSON feeds a dashboard with budget bars and threshold alerts. Both are reading a flat file, no live API calls during rendering. The hourly cron does the expensive work once, everything downstream reads the result.
Why not just use ccusage?
ccusage reads Claude Code and Codex JSONL logs, giving you per-model cost breakdowns with date filtering. It’s better than the collector at USD cost tracking and historical queries. If that’s what you need, use it.
I built my own because the collector does three things ccusage doesn’t:
- It tracks Gemini (1,000 req/day free tier, no JSONL logs to read, only session file parsing).
- It acts on the data (configurable spend alerts, pipeline kill switches when costs spike).
- It burns unused Codex budget on maintenance tasks when weekly utilization drops below 60%.
It also doesn’t require an additional MCP server. It reads a flat JSON file.
The usage data exists somewhere in every AI CLI. It might be an undocumented endpoint, a pile of session files, or a JSON-RPC server. An hourly cron that normalizes it all into one JSON file is about 250 lines of bash, Python, and JavaScript. An afternoon of reverse engineering, once you know where to look.
<\!-- faqpage-schema-quota --> <\!-- /faqpage-schema-quota --> <\!-- /wp:html -->The same data drives automation, not just alerts. When Codex weekly usage drops under 60 percent, a cron pulls a maintenance task off the queue and spends the slack. When Gemini comes in under 900 sessions for the day, a research queue does the same. Unused budget gets used instead of expiring.
What I learned
- Quota visibility is an afterthought for every vendor: Claude hides it behind an undocumented endpoint, Gemini ships no endpoint at all, and Codex buries it in a JSON-RPC server the docs don’t mention.
- The Claude endpoint is beta and its header is versioned (
anthropic-beta: oauth-2025-04-20). A dated version string means it has changed once already, so the collector can break silently when it changes again. - The Codex tmux-scraping rig was a hack; the
app-serverJSON-RPC interface, found by reading the source, was the reliable path. Check for a server mode before building a screen scraper. - After writing
latest.jsoneach hour, the collector appends one compact line toquota/history/YYYY-MM-DD.jsonl, so a “when did I blow through my limit last week?” query is already answerable from disk:
jq -r '.claude.five_hour.utilization' quota/history/2026-03-11.jsonlHow a CEO uses Claude Code and Hermes to do the knowledge work
A blank or generic config file means every session re-explains your workflow. These are the files I run daily as CEO of a cybersecurity company managing autonomous agents, cron jobs, and publishing pipelines.
- CLAUDE.md template with session lifecycle, subagent strategy, and cost controls
- 8 slash commands from my actual workflow (flush, project, morning, eod, and more)
- Token cost calculator: find out what each session is actually costing you
One email when the pack ships. Occasional posts after that. Unsubscribe anytime.